

Get More Done
Type less and let Wing worry about the details. Use AI to write & redesign your code. Work interactively in the live Python runtime. Easily navigate code and documentation.
Write Better Code
Avoid common errors and find problems early with assistance from Wing's deep Python code analysis. Keep code clean with smart refactoring, code inspection, and reformatting.
Find Bugs Faster
Debug any Python code. Inspect debug data and try out bug fixes interactively without restarting your app. Work locally or on a remote host, VM, or container.
Wingware's 25 years of Python IDE experience bring you a more Pythonic development environment. Wing was designed from the ground up for Python, written in Python, and is extensible with Python. So you can be more productive.
Supported Platforms | Python Versions
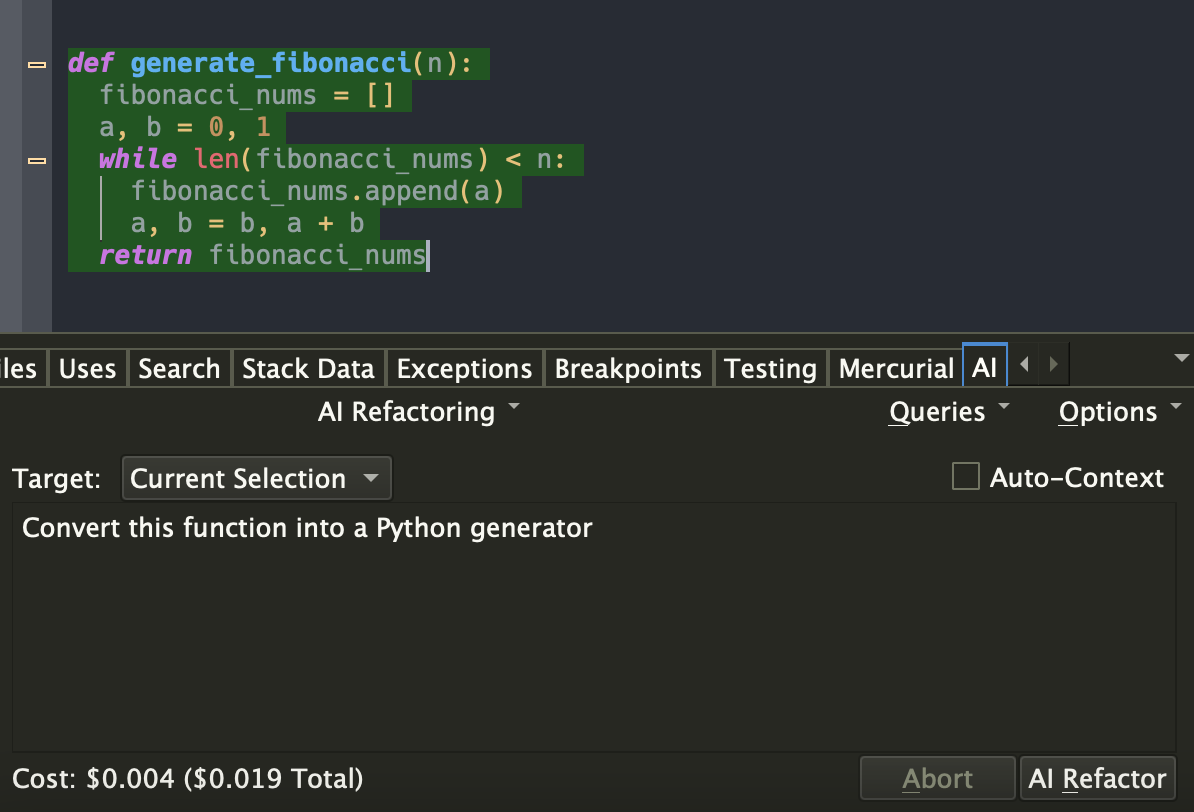
AI Assisted Software Development
You can ask Wing to use generative AI to (1) implement missing code at the current input position, (2) refactor, rewrite, or extend existing code by describing the changes you want to make, (3) write entirely new code from a description of its intended functionality and design; and (4) chat in order to work through understanding and improving code. Examples requests include "convert this function into a Python generator", "rewrite this threaded code to instead run asynchronously", and "create unit tests for class A". Your role changes from writing code manually to directing an intelligent assistant capable of completing a wide range of programming tasks.
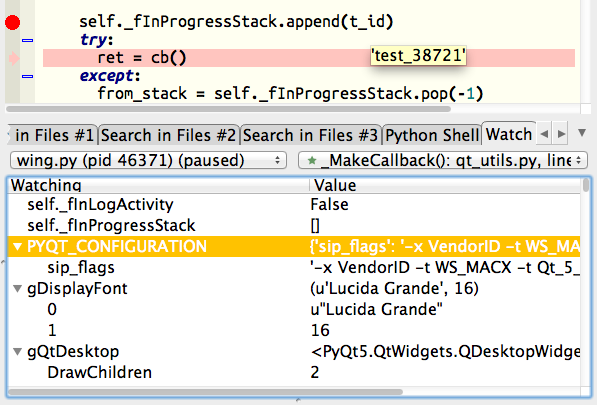
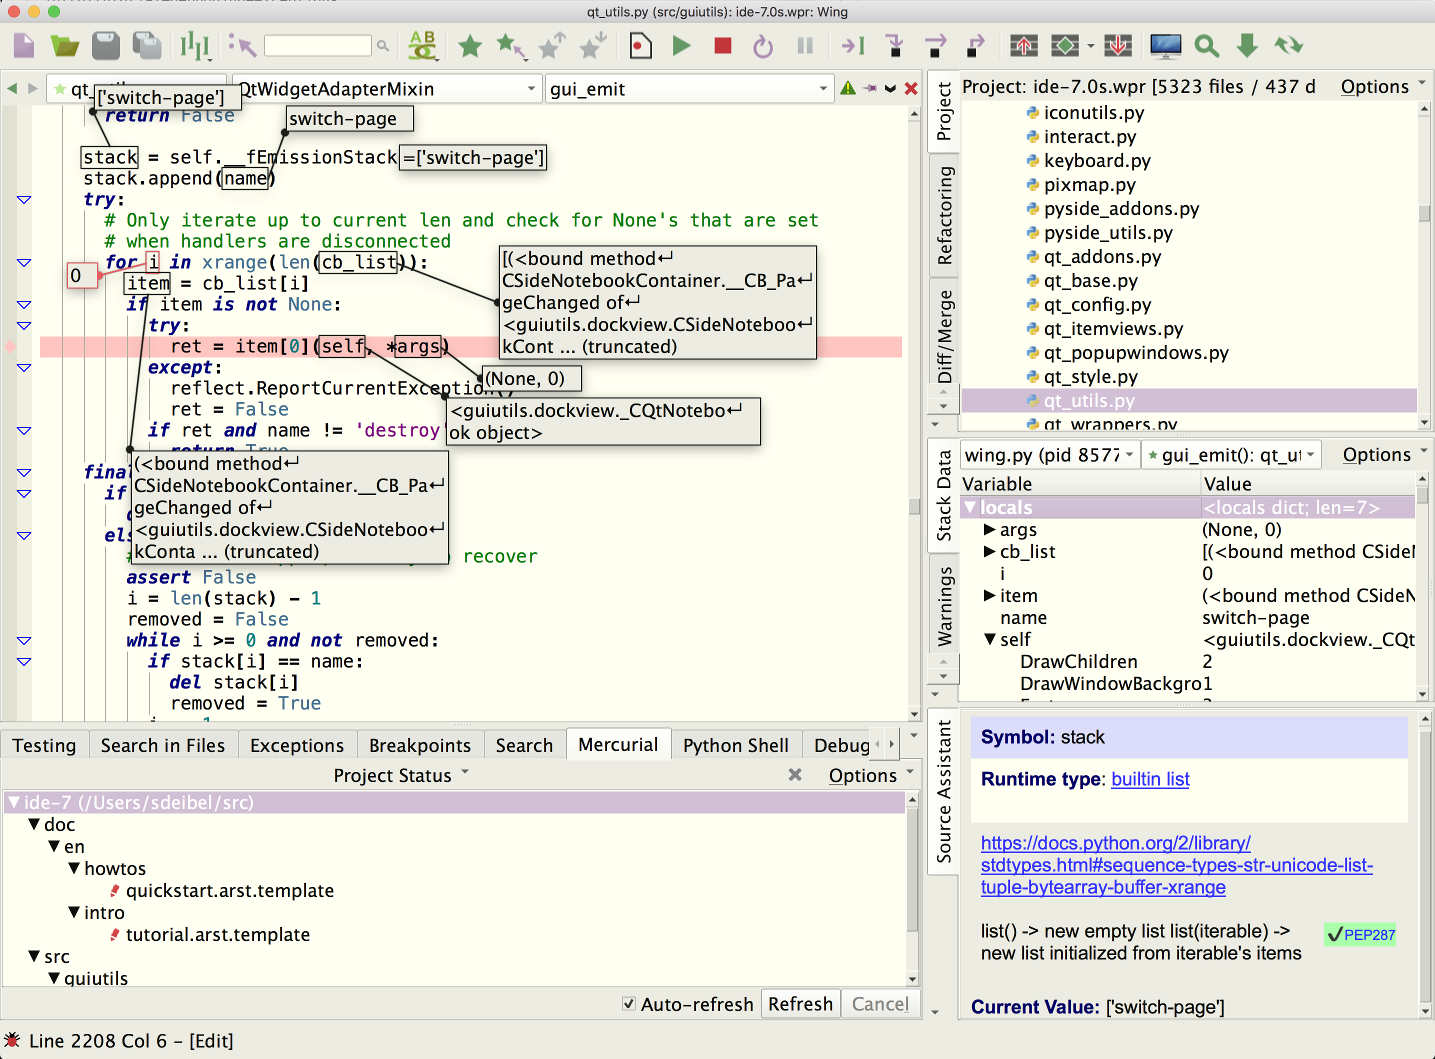
Powerful Interactive Debugger
Wing's debugger makes it easy to fix bugs and write new Python code interactively. Use conditional breakpoints to isolate a problem, then step through code, inspect data, try out bug fixes with the Debug Console's command line, watch values, and debug recursively. You can debug multi-process and multi-threaded code launched from the IDE, hosted in a web framework, called from an embedded Python instance, or run on a remote host, VM, container, or cluster. Wing also provides an array and dataframe viewer for scientific and data analysis tasks.
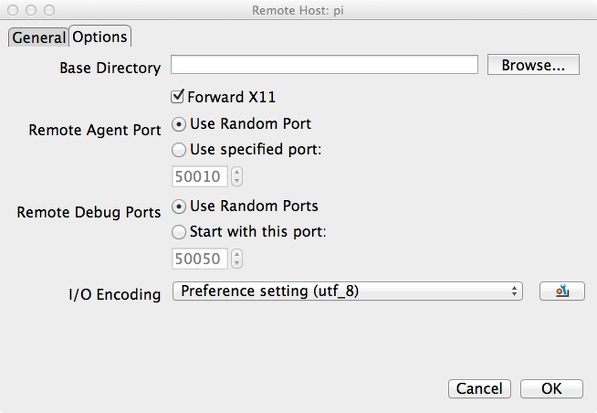
Remote and Container Development
Wing's quick-to-configure remote development support delivers all of Wing's features seamlessly and securely to Python code running on a remote host, VM, container, or cluster. Remote development is possible to hosts running macOS and Linux, including those hosted by Docker, Docker Compose, AWS, Vagrant, WSL, Raspberry Pi, and LXC/LXD.
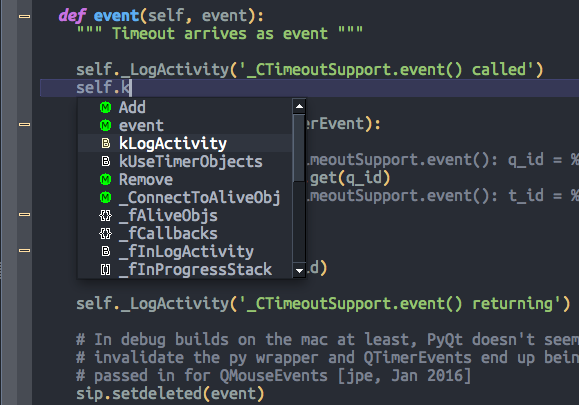
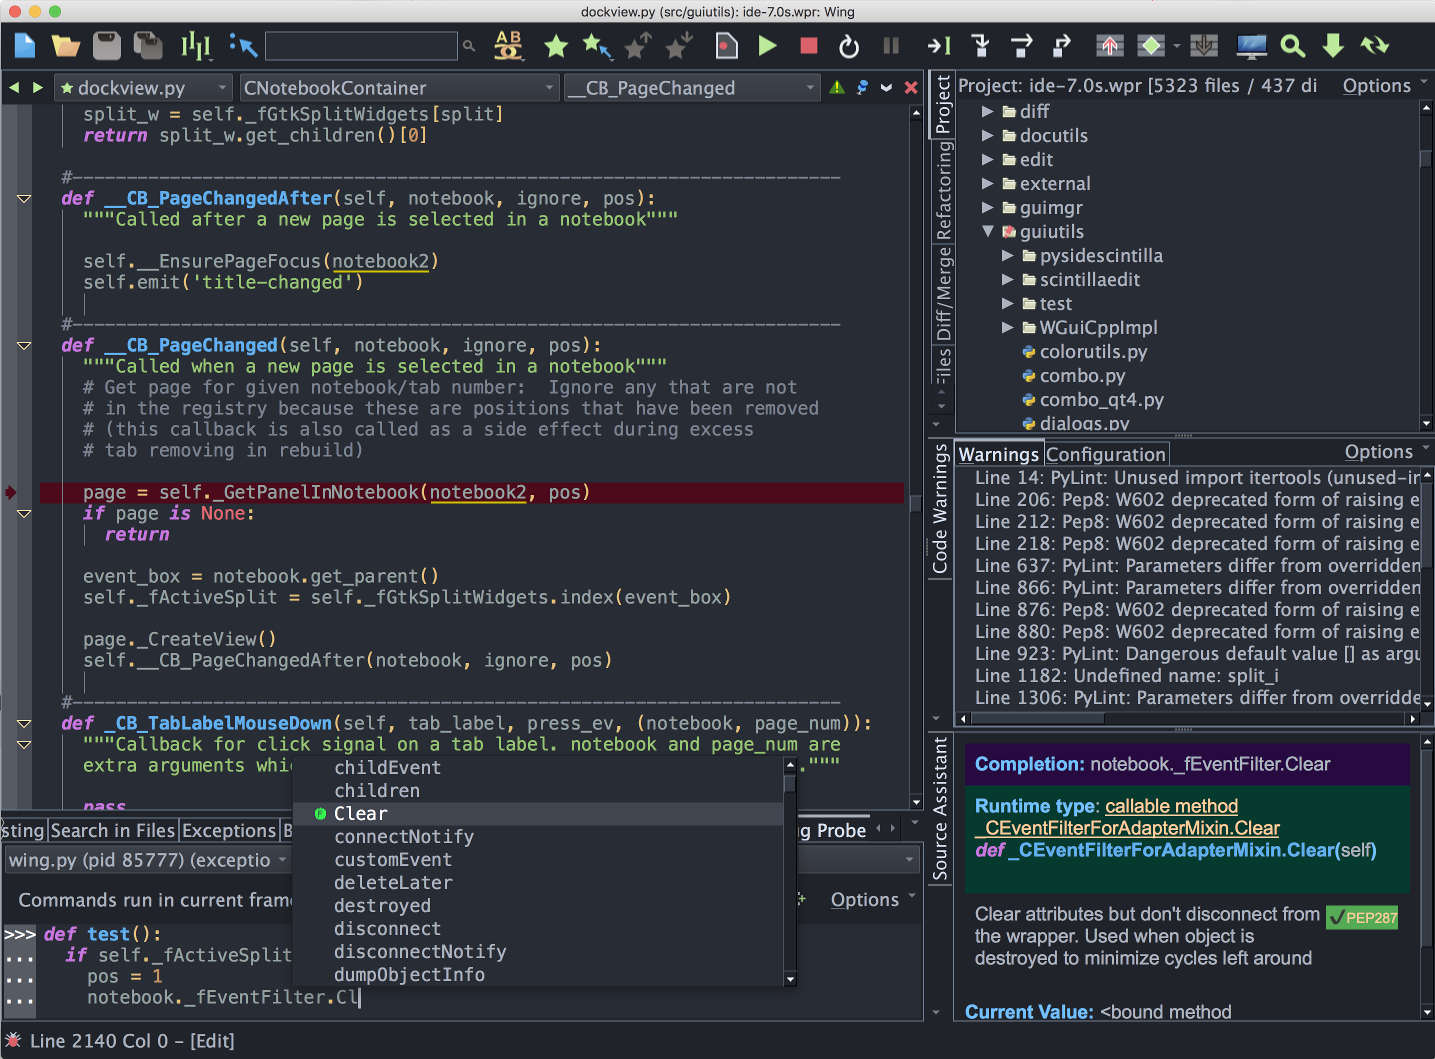
Intelligent Editor
Wing's editor speeds up interactive Python development with context-appropriate auto-completion and documentation, inline error detection and code quality analysis, PEP 8 enforcement, invocation assistance, auto-editing, import management, refactoring, code folding, multi-selection, customizable code snippets, and much more. Wing can emulate vi, emacs, Eclipse, Visual Studio, XCode, and MATLAB.
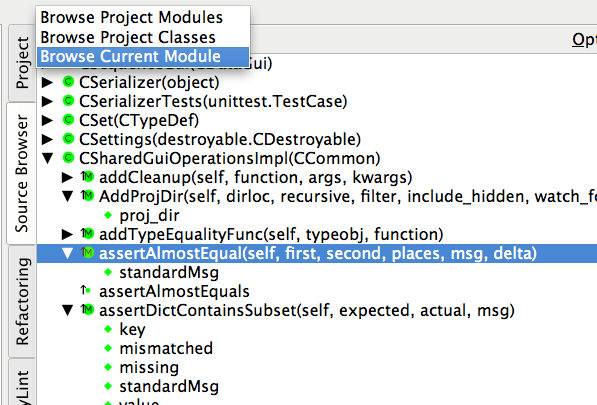
Easy Code Navigation
Wing makes it easy to get around code with goto-definition, find uses, find symbol in project, editor symbol index, module and class browser, keyboard-driven search, and powerful multi-file search. Visit history is stored automatically, so you can instantly return to previously visited code. Or define and traverse categorized bookmarks that track automatically as code changes.
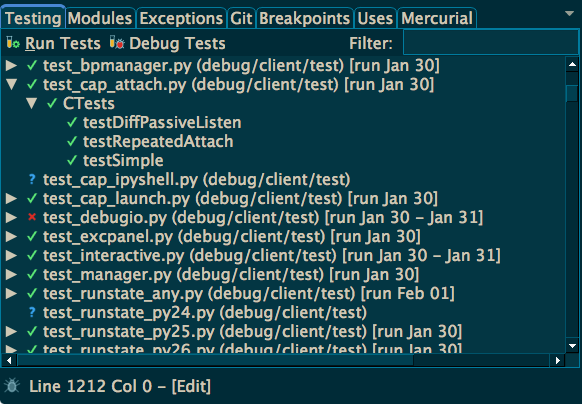
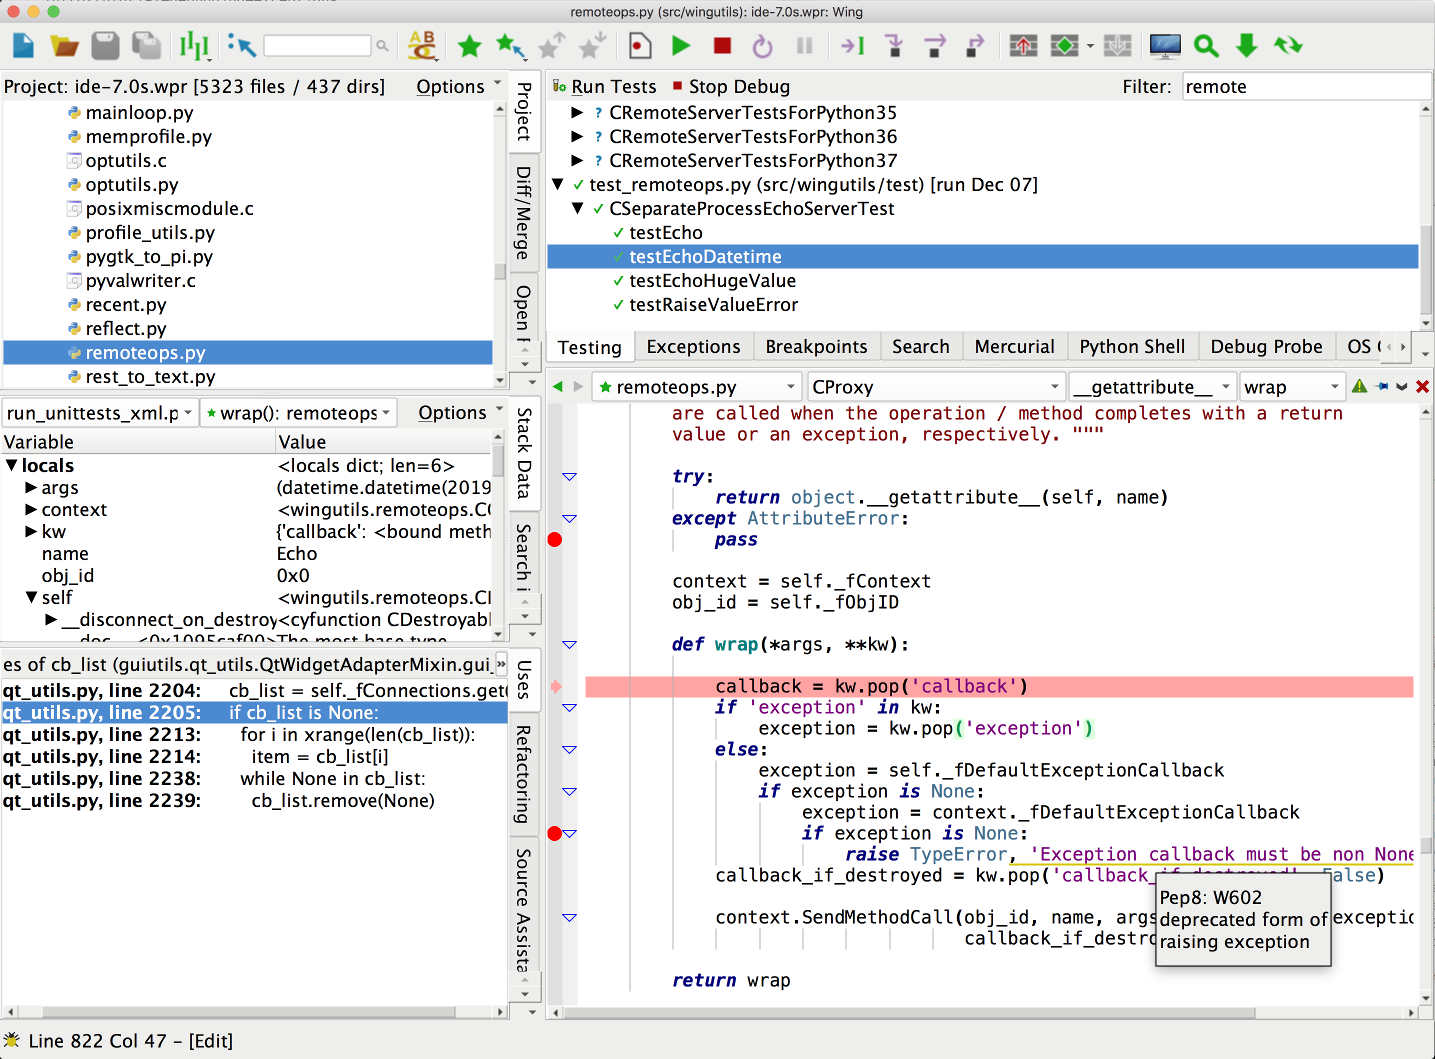
Integrated Unit Testing
Wing supports test-driven development with the unittest, doctest, nose, pytest, and Django testing frameworks. Failing tests are easy to diagnose and fix with Wing's powerful debugger, and you can write new code interactively in the live runtime context set up by a unit test. Wing can track and display code coverage for your unit tests, so that you know how well your tests are exercising your code. Coverage data is also used to determine when edits to your code invalidate previously collected test results.

Project Management
Wing's powerful project management capabilities work with Python environments managed by virtualenv, Poetry, pipenv, conda, and Docker, with revision control using Git, Mercurial, Perforce, Subversion, or CVS. You can easily create new Python environments from Wing, add, remove, or update Python packages, and freeze your package configuration for use by other developers.
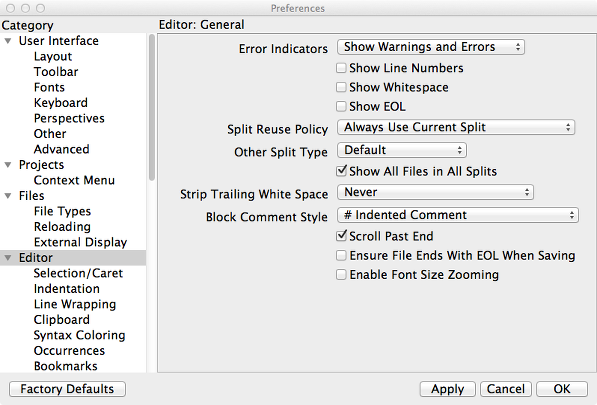
Customizable and Extensible
Wing offers hundreds of configuration options affecting editor emulation, display themes, syntax coloring, UI layout, and much more. Easily switch to and from dark mode, magnify the interface for presentations and meetings, and use perspectives to manage task-specific UI configurations. New IDE features can be added by writing Python code that calls down to Wing's scripting API. You can even develop and debug your extension scripts with Wing.
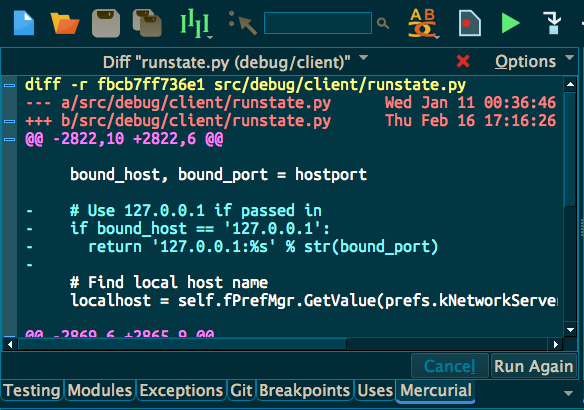
And Much More
Other features include a difference/merge tool, code reformatting with Ruff, Black, YAPF, and autopep8, indentation style conversion, and executing OS command lines. Wing runs on Windows, macOS, and Linux, and also supports remote development to macOS and Linux, including Raspberry Pi and other ARM Linux devices.
Not all features are available in Wing Personal and Wing 101. Compare Products
Questions? Email us! We are dedicated to providing top-notch support.

Anthony Floyd
Engineering Lead at Convergent Manufacturing Technologies, Inc.
We are a specialized engineering company that writes desktop applications for engineers to perform process simulation and related data analysis. We have been using Wing Pro for the past decade with a small team of developers. We could not be happier with the product and the support!
The debugger and code navigation tools are some of the best features in Wing Pro. It is very easy to trace problems through complicated code. It is easy to jump to areas of code that you need to find. The editor is theme-able and many of our team work in 'dark mode'.
The support is also great. Issues get responded to quickly and fixes pushed within days.

Ram Rachum
Python Consultant and Open Source Developer
I've been using Wing Pro as my main development environment for 10 years now. I've used it for my open-source projects, my client projects when I was working as a freelancer, and now at my work in a corporate environment. I do Python programming almost exclusively, so Wing's Python-centric approach is a good fit for me.
The debugger is first-class. It works on multi-process, multi-thread programs and supports remote debugging. The editor is great. It's got VI and emacs mode and it's extensible with Python scripts. The support staff is great. I've made many suggestions and requests for improvement to them over the years, and they've implemented many of them. Bugs are fixed quickly.
Overall, I highly recommend Wing Pro!
Scientific and Data Analysis
Wing's focus on interactive development works well for scientific and data analysis with Jupyter, NumPy, SciPy, Matplotlib, pandas, and other frameworks. The debugger's dataframe and array viewer makes it easy to inspect large data sets.
Web Development
Wing supports development with Django, Flask, web2py, Pyramid, Google App Engine, and other web frameworks. The debugger can step through Django and web2py templates. Wing works seamlessly with code running on a remote host, virtual machine, or container hosted by Docker, WSL, Vagrant, AWS, or LXC/LXD.
Animation and Games
Since Wing's debugger can run in embedded instances of Python, it can be used to develop scripts for Blender, Autodesk Maya, NUKE, Source Filmmaker and other modeling, rendering, and compositing applications that use Python. Wing also works with pygame and other Python-based game engines.
Desktop Apps and More
Wing can develop, test, and debug desktop applications with PyQt, wxPython, Tkinter, and other UI development frameworks. Scripting, Raspberry Pi, and other types of development are also supported.
New in Wing Pro
Wing 10 adds AI assisted code development and refactoring, support for Python 3.12 including faster debugging with the new PEP 669 low-impact monitoring API, Poetry for package management, Ruff for code warnings and reformatting, & more.
Wing 9.1 adds auto-import and import management, collects and displays code coverage for unit tests, uses coverage data to invalidate test results when code is edited, adds support for Python 3.11, reduces debugger overhead in Python 3.7+, speeds up running unit tests, streamlines configuration of light and dark theming, adds two light display themes, and makes improvements to New Project for Docker and Django, auto-invocation, multi-threaded debugging, code analysis, & more.
Join our Happy Customers!
Wing Pro is used on every continent by Python developers like you. Find out why today!